
Feature | Debug Toolbox for Demoshop
We have officially decoupled store demonstration from backend diagnostics by introducing a dedicated, developer-style Toolbox container in the Tweakwise Demoshop. Over time, as we added rich debugging data to help teams trace rules and verify configurations, the UX of the Demoshop has become a bit cluttered. The new Toolbox cleans up the interface, grouping all developer insights and debug information into a single panel without compromising the clean presentation of the Demoshop itself.
Why the Demoshop is essential for Your team
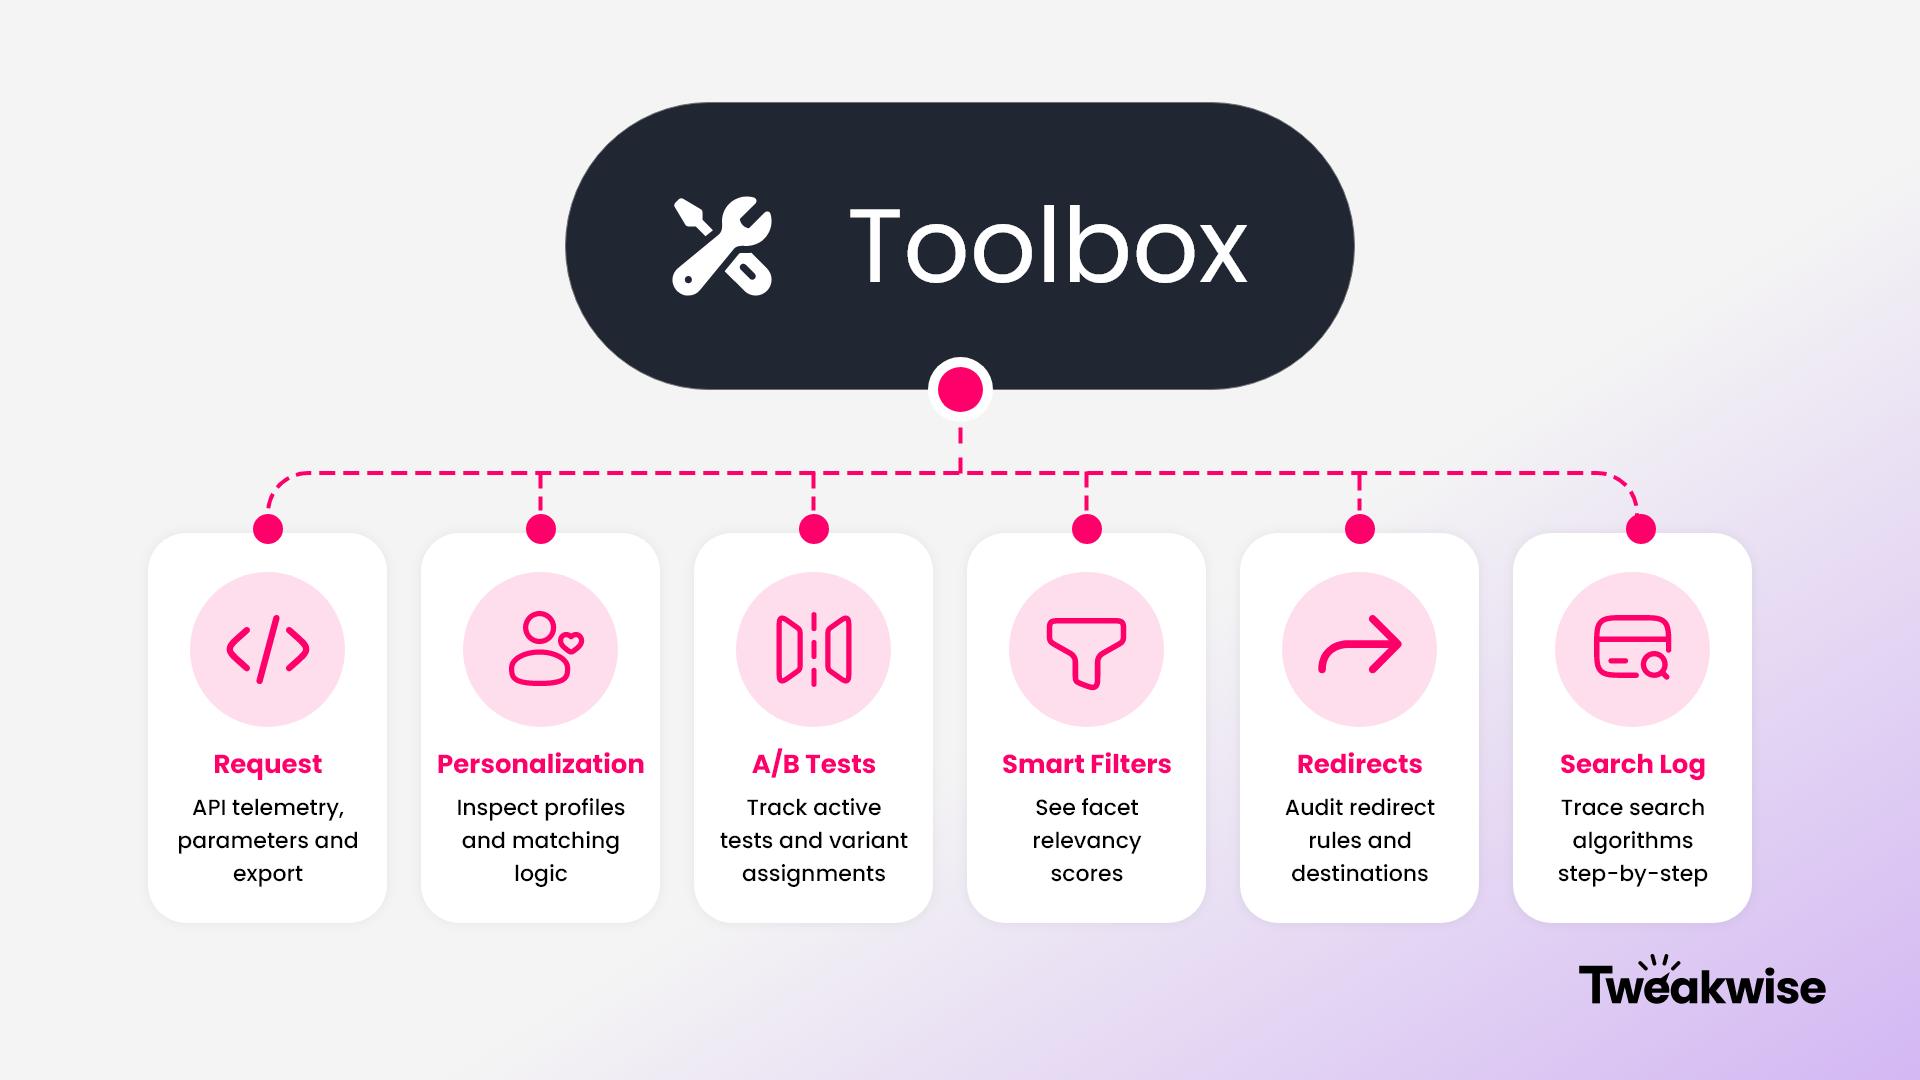
One of the main functions of the Tweakwise Demoshop is to accelerate troubleshooting by instantly validating why specific products appear, how personalization engine rules evaluate, and which backend parameters trigger given search results. The new Toolbox consolidates detailed operational telemetry across seven key tabs:
| Toolbox Tab | Focus | Practical Value |
|---|---|---|
| Home | Overview | Central entry point. |
| Request | API Telemetry | Displays full Request URL, parameters (tn_cid, tn_lang, tn_profilekey), and provides quick export links for JSON or XML. |
| Personalization | Profile Matching | Inspects active profile keys, AI-driven profile descriptions, and profile matrices to debug tailored user experiences. |
| A/B Tests | Variant Tracking | Shows active test runs and identifies exact variant assignments for current sessions. |
| Smart Filters | Facet Relevance | Displays relevancy scores (match percentages) to confirm automated filtering logic. |
| Redirects | Navigation Logic | Audits search-triggered redirect rules to verify user routing destinations. |
| Search Log | Search Execution | Traces executed search algorithms step-by-step to explain exact product ranking outcomes. |
Open the Tweakwise Demoshop via the App, click the Toolbox icon at the bottom of the screen, and navigate between tabs to immediately inspect API payloads, user profiles, or algorithm behavior.