
Insights | New Merchandising Report
Today we launch a major expansion of our Insights module with the introduction of the Merchandising Report. For a long time, merchandisers have built storefront fancy layouts and sorting rules based on a mix of experience, brand priorities, and foremost intuition. While creativity is essential, understanding the behavioral impact of those decisions has often felt like a guessing game. This new report bridges that gap, transforming black-box configurations into clear performance metrics. By bringing transparency to your merchandising efforts, we are empowering you to confidently back up every aesthetic and structural decision with cold, hard data.
Builder Component CTR
At the heart of this update is a deep dive into the performance of your Builder Components. Merchandisers can now track exactly how users interact with your carefully positioned components. By exposing metrics like Click-Through Rates (CTR) for individual components, the report reveals what truly captures customer attention and what gets ignored. This means you no longer have to wonder if a component is driving value; you can immediately identify underperforming elements, experiment with new placements, and continuously optimize your layouts to maximize engagement and, eventually, conversion.
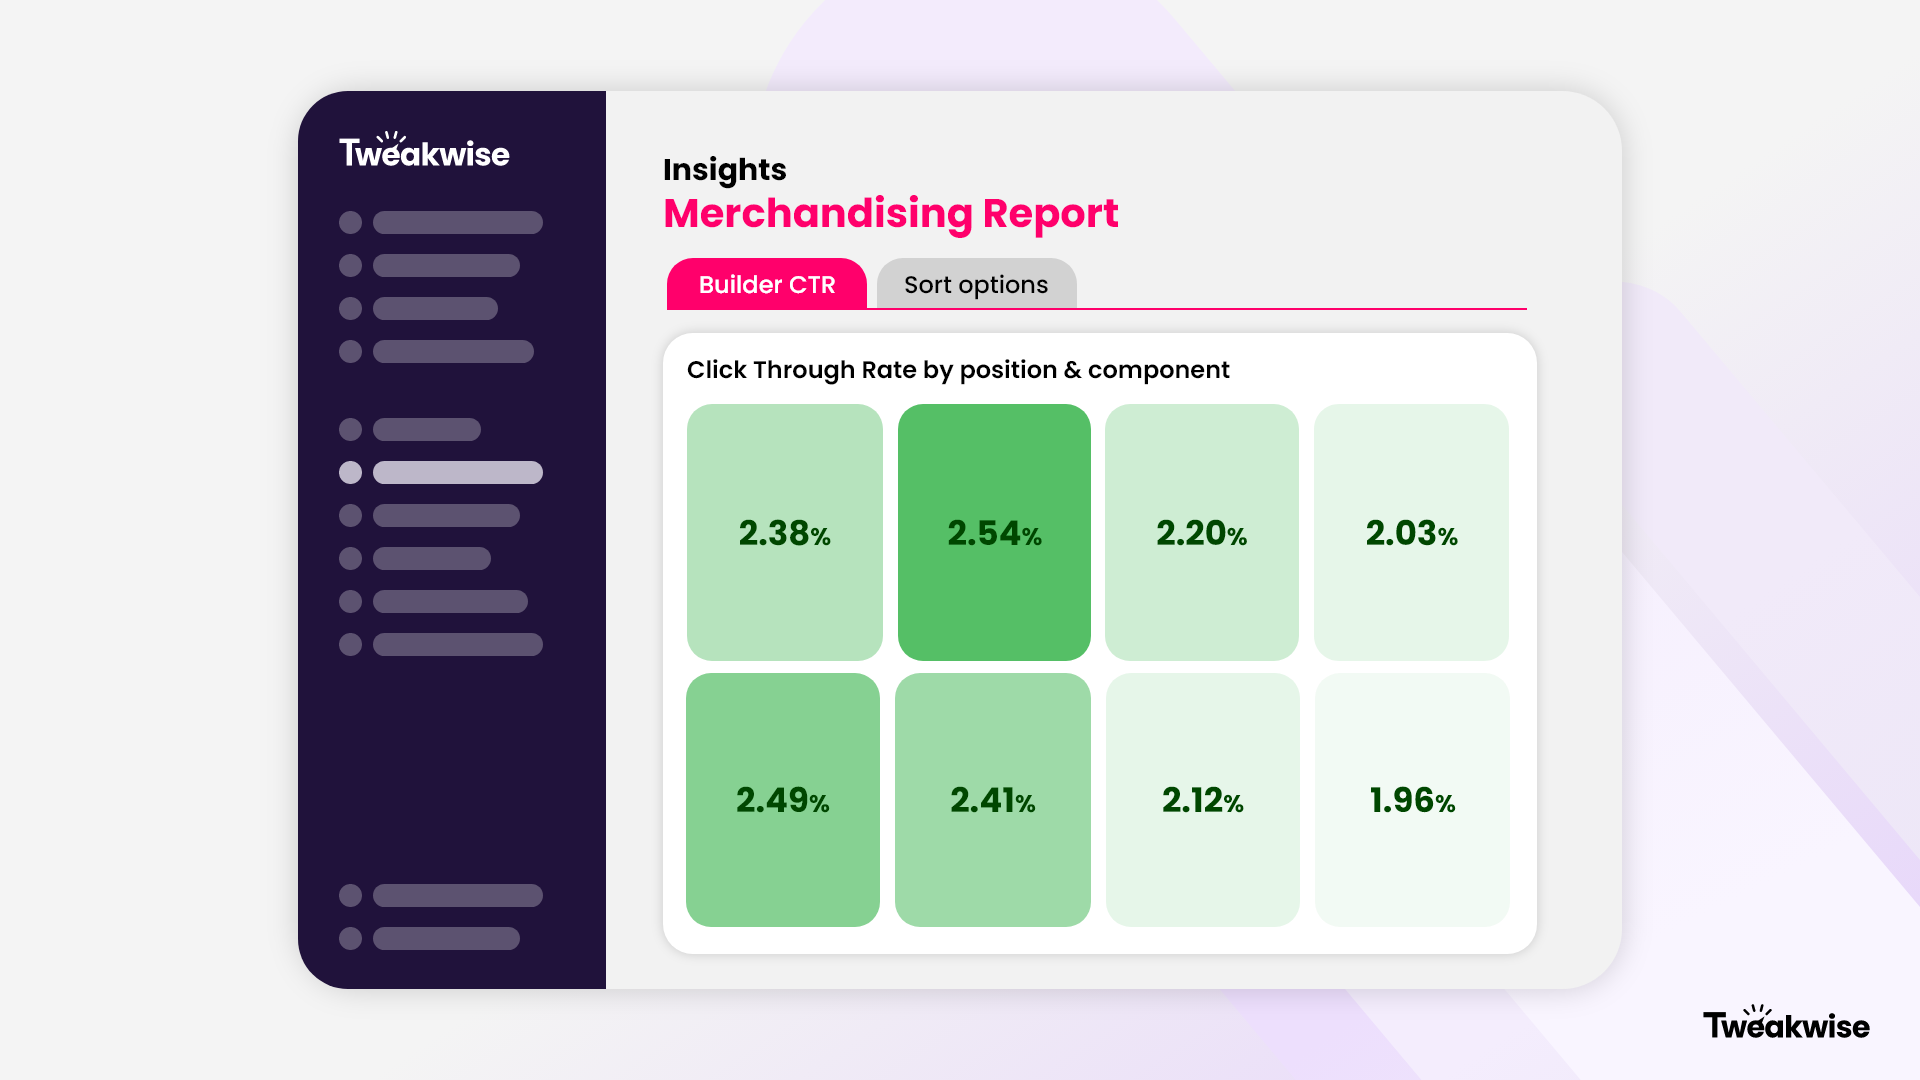
- Builder Click Through Rates: Analyze your Click-Through Rate (CTR) per position, per builder. CTR is calculated as clicks divided by impressions. This differs from the Builder Click Distribution shown in the App, as this metric is calculated over the total number of impressions instead of the number of clicks. Performance is easy to read thanks to a color-coded heatmap. The greener the cell, the higher the CTR.
- Component Click Through Rates: Discover which component types drive the highest Click Through Rate (CTR). By selecting a specific Builder, you can see which component types have the highest CTR percentage. This page also provides a high-level overview of total page impressions, total clicks and the overall CTR percentage per Builder.
Event TagImplementing the Tweakwise Event Tag is essential to analyze the performance of your configuration, power our insights reports and support personalization. To support this, Tweakwise needs key e-commerce events on your platform. For the Merchandising Report, at least we expect
ItemClicksandPageImpressionsfrom the Event Tag to be implemented on your platform.
Sorting options
Beyond Builder component metrics, the Merchandising Report provides unprecedented clarity into the engine behind your product discovery: your sorting templates and options. The order in which products appear can make or break an e-commerce strategy, yet evaluating the effectiveness of a complex sorting rule has historically been a challenge. With this new report, you can analyze the real-world performance of various sorting methods across your categories and search results. This visibility allows you to quickly determine whether a new margin-focused sorting rule is outperforming a traditional popularity-based setup, or if specific sorting templates are causing friction in the customer journey.
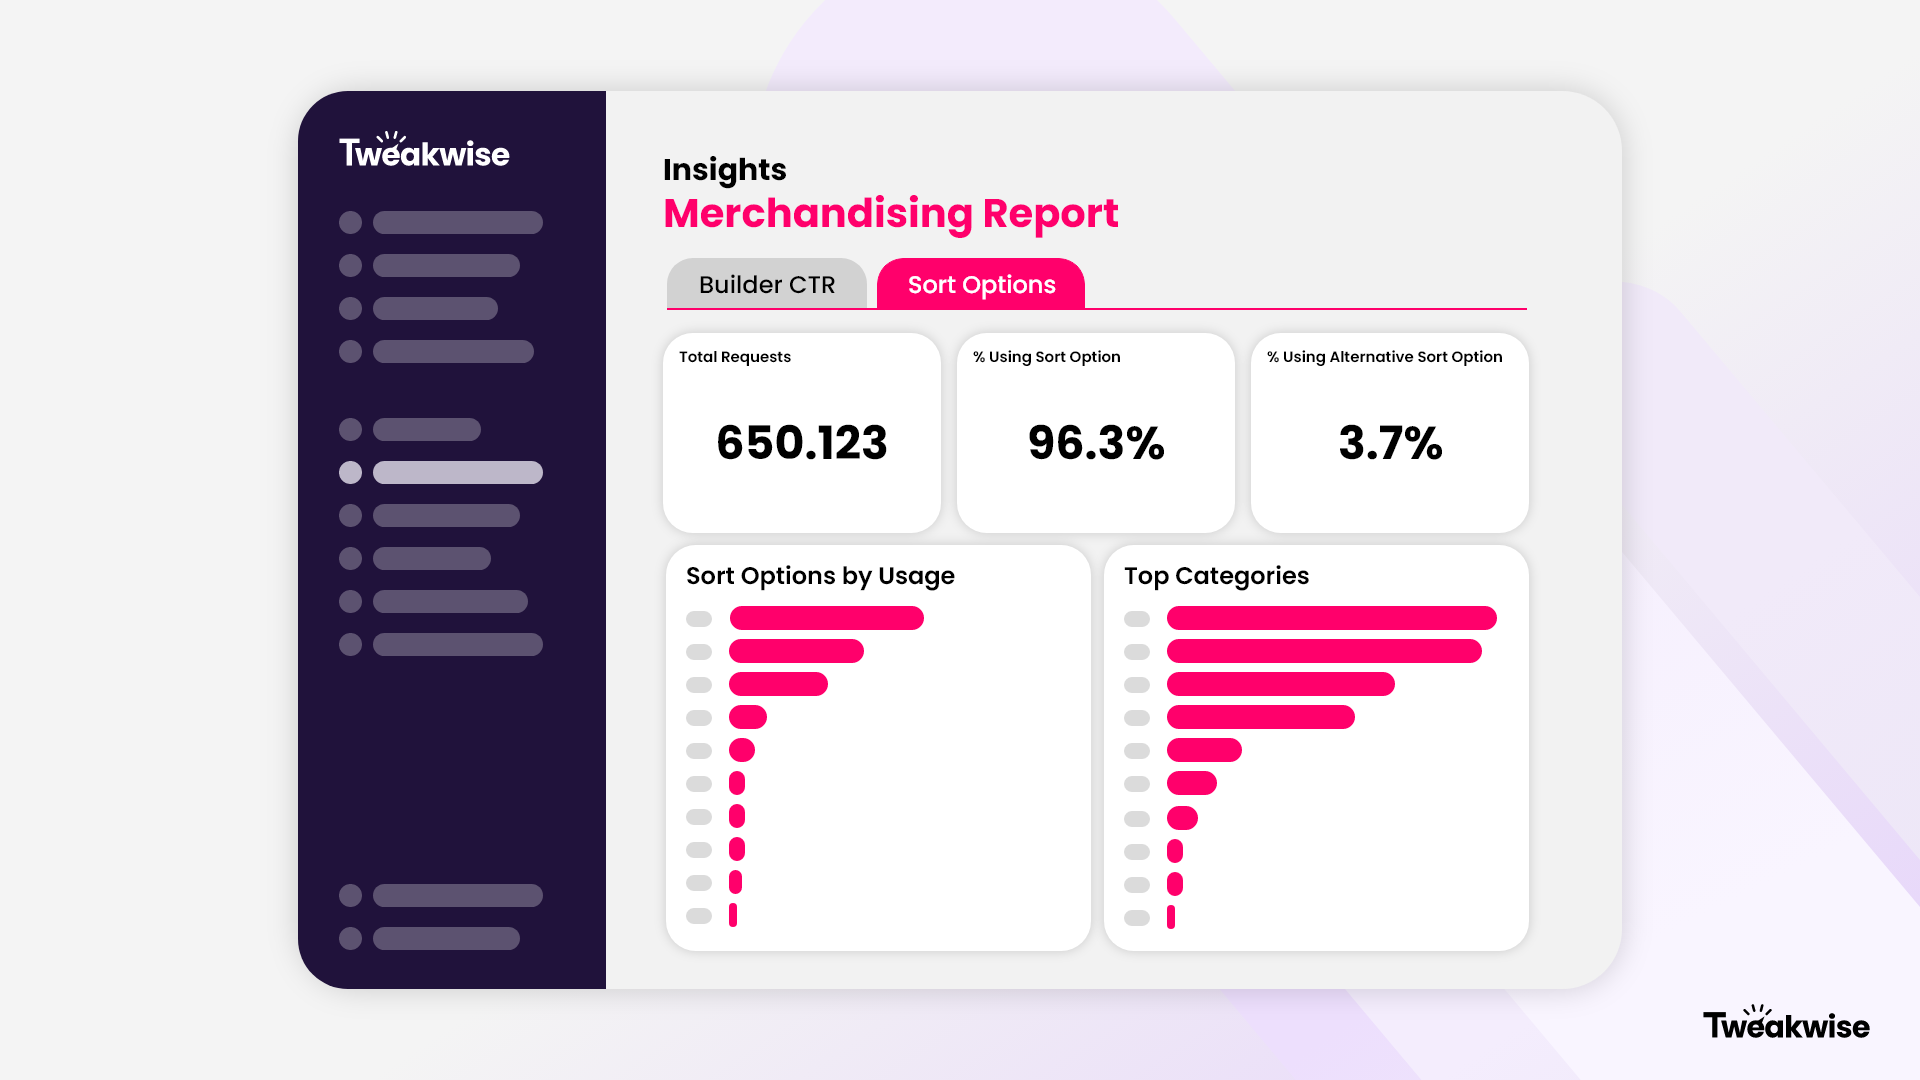
Ultimately, this update is about closing the feedback loop between configuration and analysis. By centralizing Builder utilization and sorting metrics right within Tweakwise Insights, we are eliminating the need to piece together data from fragmented third-party analytics tools. Your team now has a single, reliable source of truth to justify their merchandising strategies to stakeholders, streamline their daily workflows, and deliver a highly optimized shopping experience that drives measurable business growth.