Insights | Session-differentiation & Exports
Every visitor on a platform leaves behind substantial data like search queries, views, clicks, and purchases. Tweakwise helps by connecting these separate data points, revealing patterns, and guiding users toward better choices through comprehensive Insights reports. These reports already allow you to discover what is truly happening on your platform and how visitors search, filter, and convert.
We are excited to announce two major expansions: the Conversion Report has been updated with session-differentiation, and we're introducing Data Exports.
Measuring the true impact of search
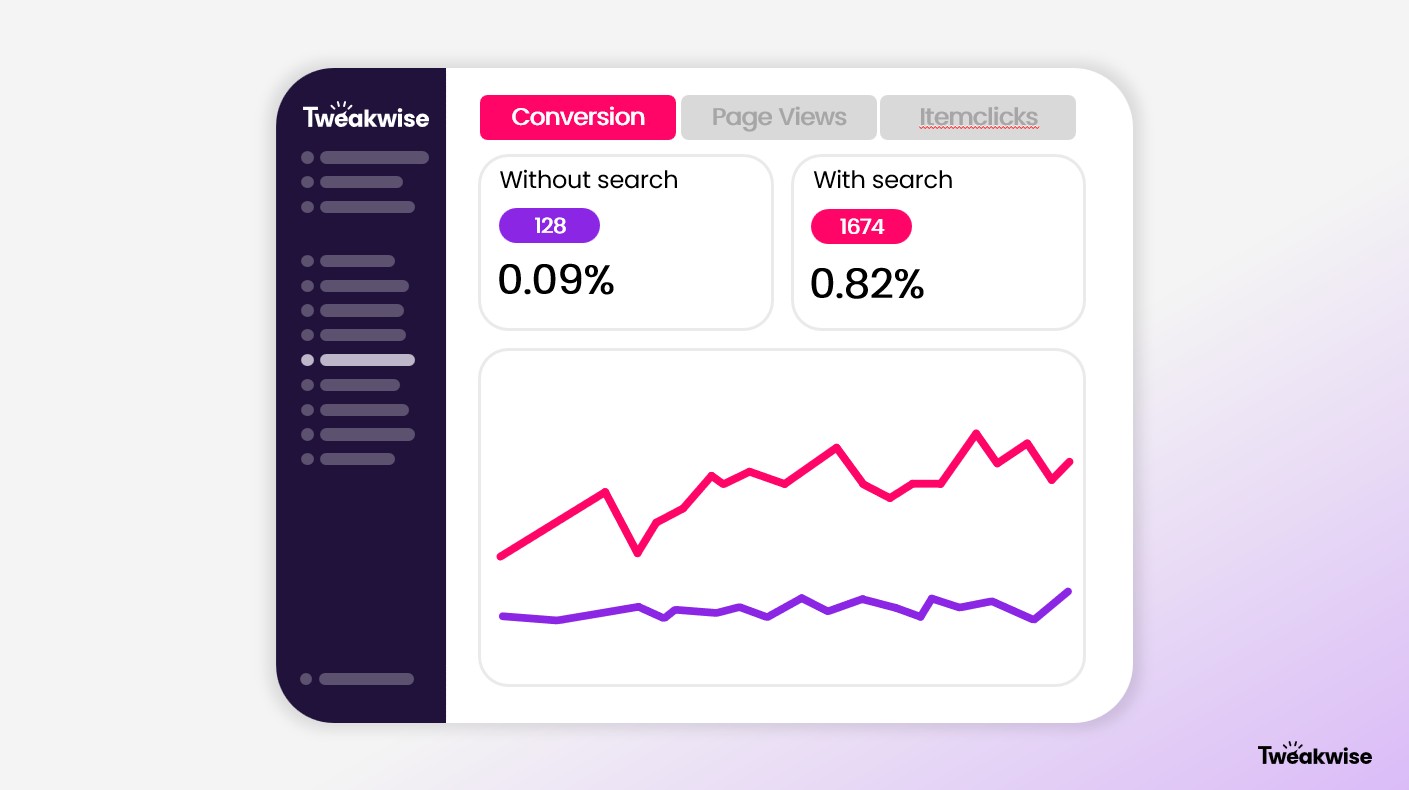
The Conversion Report has been upgraded to provide a sharper view of how onsite search contributes to your platform’s performance.
The biggest addition is the ability to now clearly distinguish between conversions with and without the use of search. This separation provides immediate insight, allowing you to see at a glance how substantial the impact of search is on your total conversion.
It gives clear insight into how visitors behave differently when they interact with your search engine compared to browse-only visitors.
Event TagImplementing the Tweakwise Event Tag is essential to analyze the performance of your configuration, power our insights reports and support personalization. To support this, Tweakwise needs key e-commerce events on your platform. These are events such as product views, item clicks, add-to-carts, and purchases.
Export Data from Insights Module
To further enhance data usability and support external analysis, we are introducing Export Data functionality across the Insights Module. From now on, it is possible to export the underlying data from any chart within the Insights module. This function is available for all reports, including the E-commerce Report, Conversion Report, Task Statistics Report, Search Word Analysis Report, Usage Report, and Filtering Usage Report.
Accessing this data is simple: navigate to any report in the Insights Module, hover over the chart you wish to export, click on the three dots that appear, and select Export Data. You have the flexibility to choose between .xlsx (Excel) and .csv formats for your exported data.